Notifications
Clear all
Topic starter
12/10/2022 10:53 am
HOTSPOT
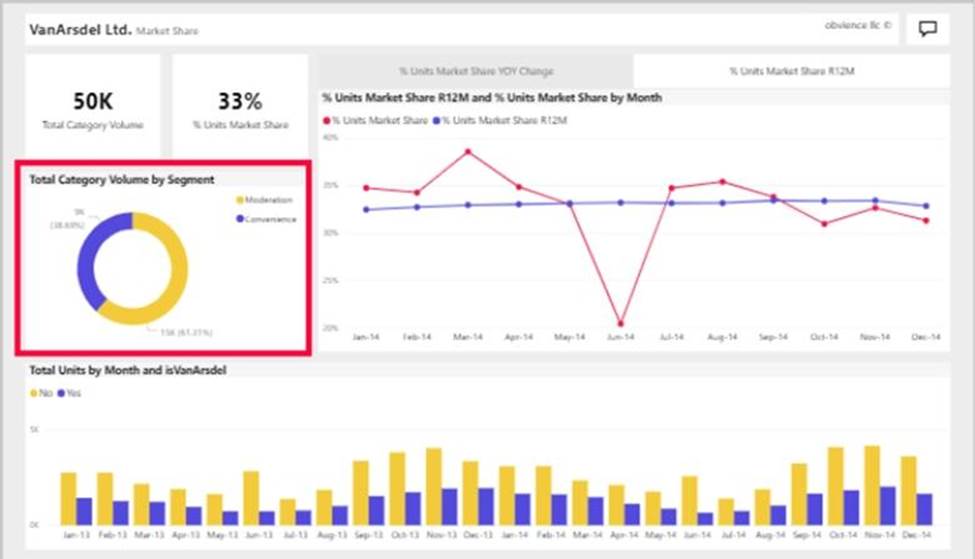
You have a report page that contains the visuals shown in the following exhibit.
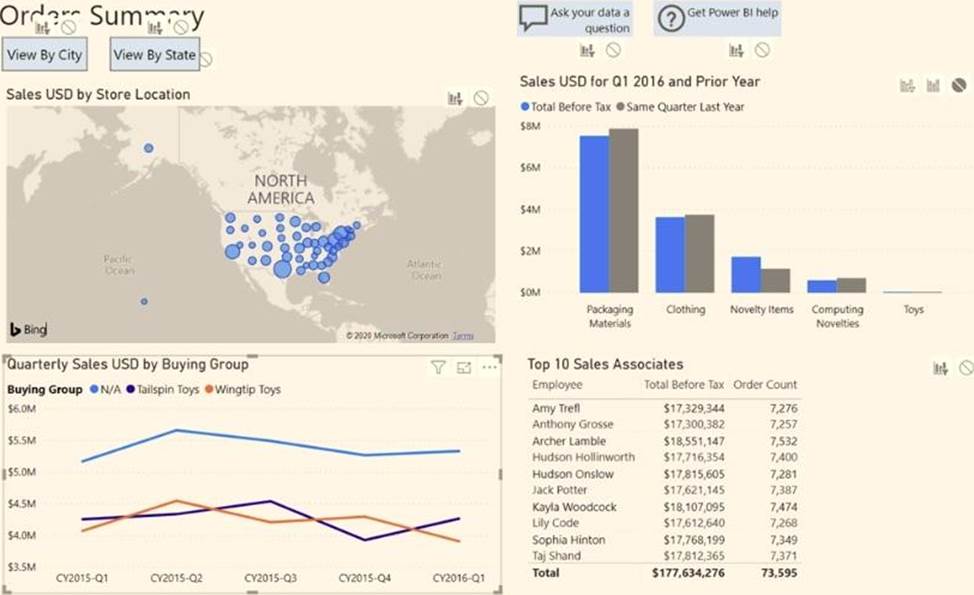
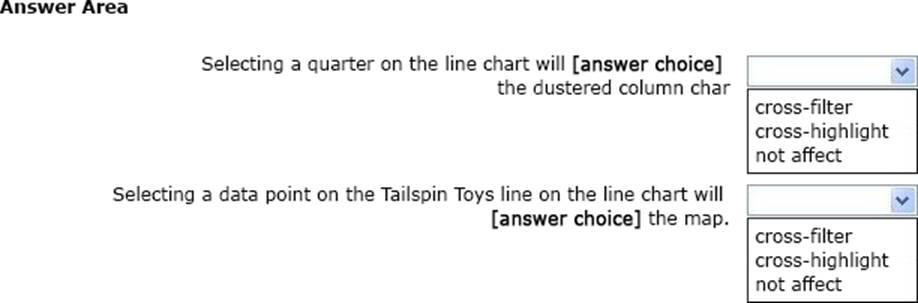
Use the drop-down menus to select the answer choice that completes each statement based on the information presented in the graphic. NOTE: Each correct selection is worth one point.
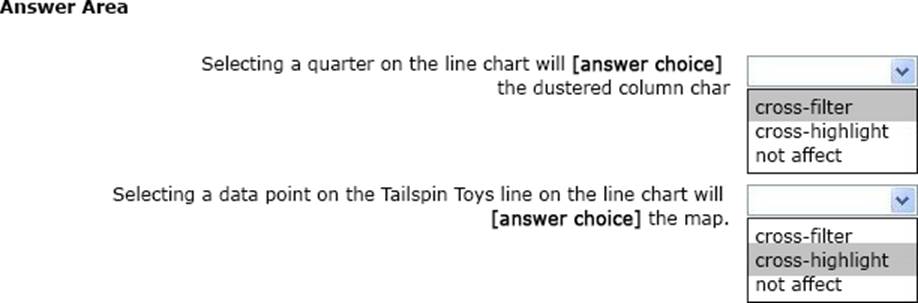
Suggested Answer:
Explanation:
Box 1: cross-filter
By default, selecting a data point in one visual on a report page will cross-filter or cross-highlight the other visuals on the page.
Box 2: cross-highlight
Example:
By default, selecting a data point in one visual on a report page will cross-filter or cross-highlight the other visuals on the page.