Notifications
Clear all
Topic starter
01/08/2022 5:32 am
HOTSPOT
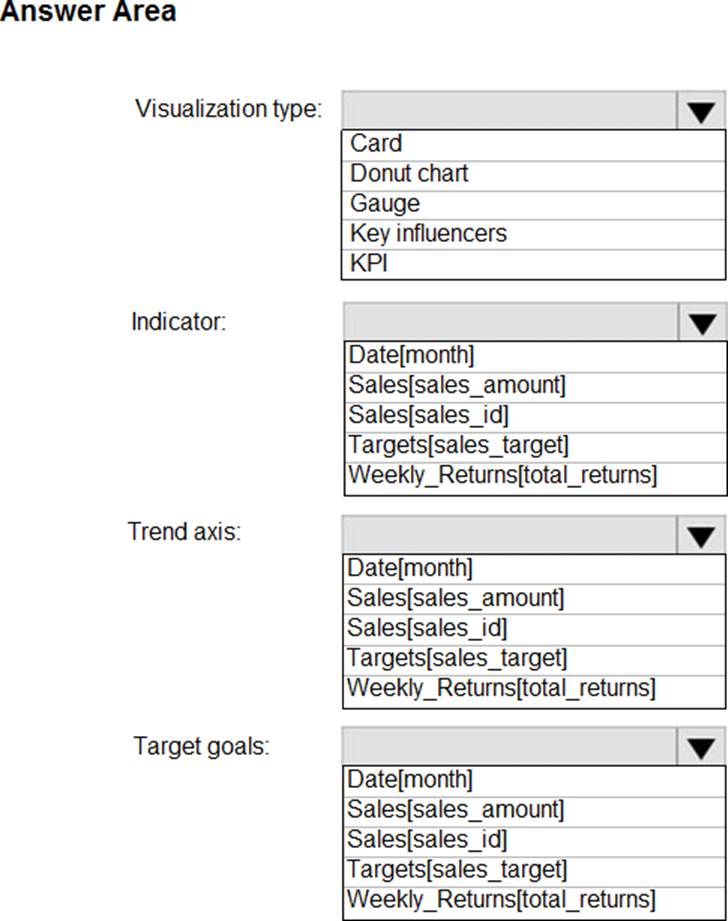
You need to create a visualization to meet the reporting requirements of the sales managers.
How should you create the visualization? To answer, select the appropriate options in the answer area. NOTE: Each correct selection is worth one point.
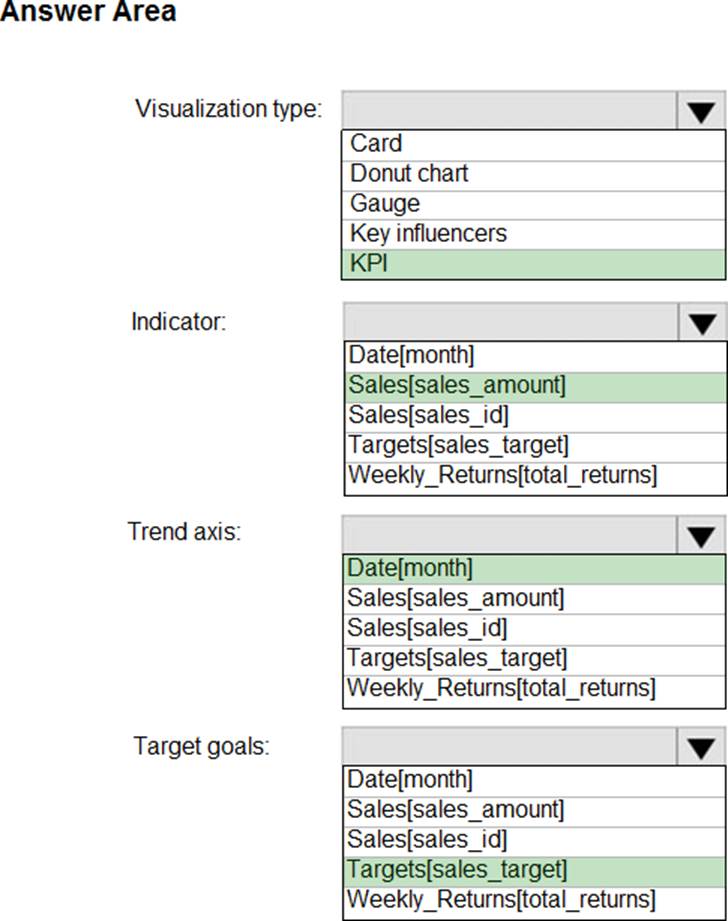
Suggested Answer:
Explanation:
Scenario: The sales managers require a visual to analyze sales performance versus sales targets.
Box 1: KPI
A Key Performance Indicator (KPI) is a visual cue that communicates the amount of progress made toward a measurable goal.
Box 2: Sales[sales_amount]
Box 3: Date[month]
Time > FiscalMonth. This value will represent the trend.
Box 4: Targets[sales_target]
Reference: https://docs.microsoft.com/en-us/power-bi/visuals/power-bi-visualization-kpi