Notifications
Clear all
Topic starter
25/10/2022 10:21 pm
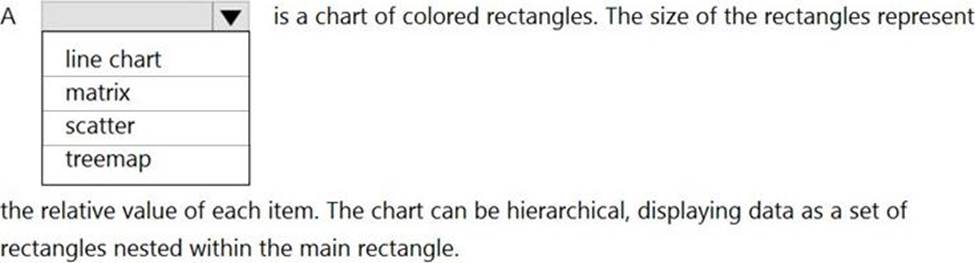
HOTSPOT
Select the answer that correctly completes the sentence.
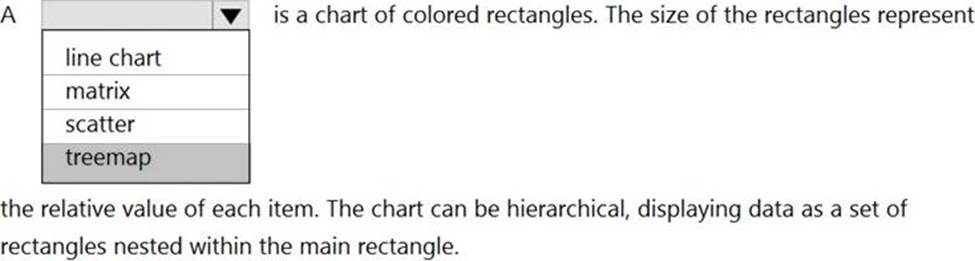
Suggested Answer:
Explanation:
Graphical user interface, text, application, email
Description automatically generated
A treemap chart divides the chart area into rectangles that represent the different levels and relative sizes of the data hierarchy.