Notifications
Clear all
Topic starter
04/09/2022 1:40 pm
You have a Power Bl report that contains the visual shown in the following exhibit.
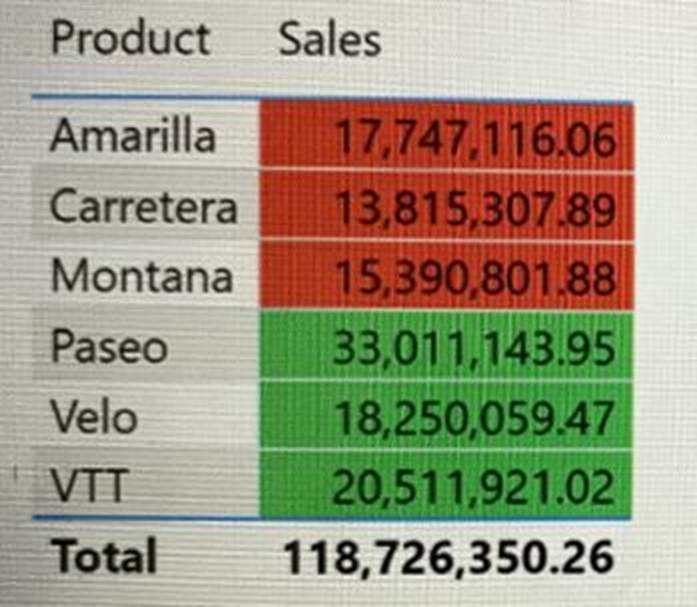
You need to make the visual more accessible to users who have color vision deficiency .
What should you do?
- A . Change the font color of values in the Sales column to white.
- B . Change the red background color to orange.
- C . Add icons to represent the sales status of each product.
- D . Add additional measures to the table values.
Suggested Answer: B