Notifications
Clear all
Topic starter
28/08/2022 9:45 am
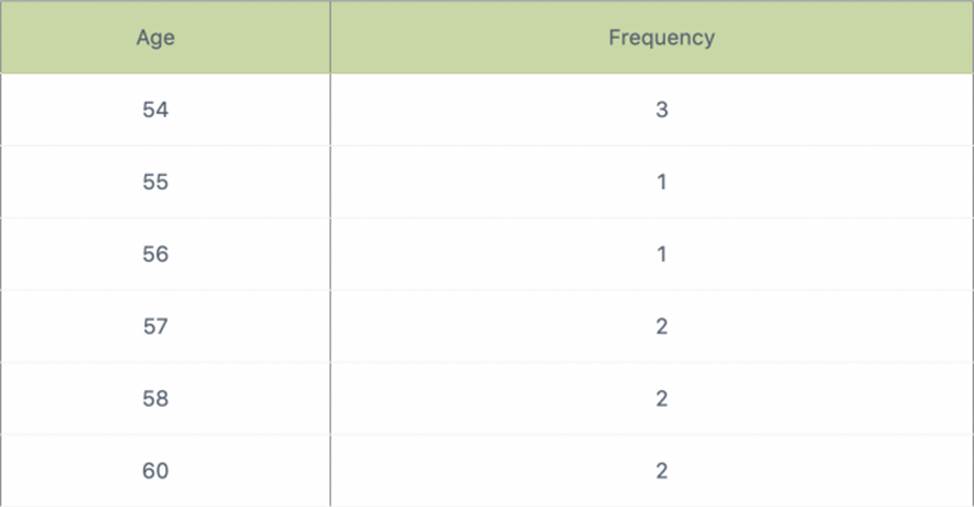
Consider this dataset showing the retirement age of 11 people, in whole years:
54, 54, 54, 55, 56, 57, 57, 58, 58, 60, 60
This tables show a simple frequency distribution of the retirement age data.
- A . 56
- B . 55
- C . 57
- D . 54
Suggested Answer: D
Explanation:
A measure of central tendency (also referred to as measures of centre or central location) is a summary measure that attempts to describe a whole set of data with a single value that represents the middle or centre of its distribution.
There are three main measures of central tendency: the mode, the median and the mean. Each of these measures describes a different indication of the typical or central value in the distribution.
What is the mode?
The mode is the most commonly occurring value in a distribution.
The most commonly occurring value is 54, therefore the mode of this distribution is 54 years.