Notifications
Clear all
Topic starter
You need to include benchmark data in a custom report created in Report Center that looks like the screenshot below .
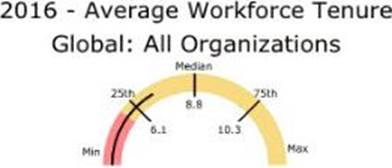
What component group do you use to create this image?
- A . Gauge
B. Image
C. Data Source
D. Chart
Suggested Answer: A
Posted : 11/11/2022 8:49 am