Notifications
Clear all
Topic starter
HOTSPOT
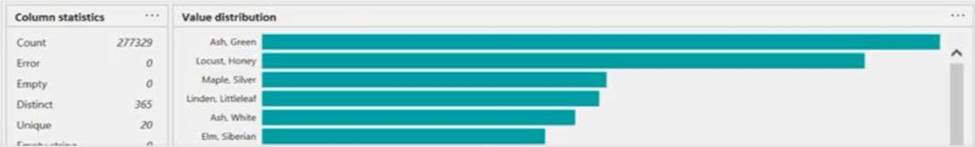
You are profiling data by using Power Query Editor.
You have a table that contains a column named column1.
Column statistics and Value distribution for column1 are shown in the following exhibit.
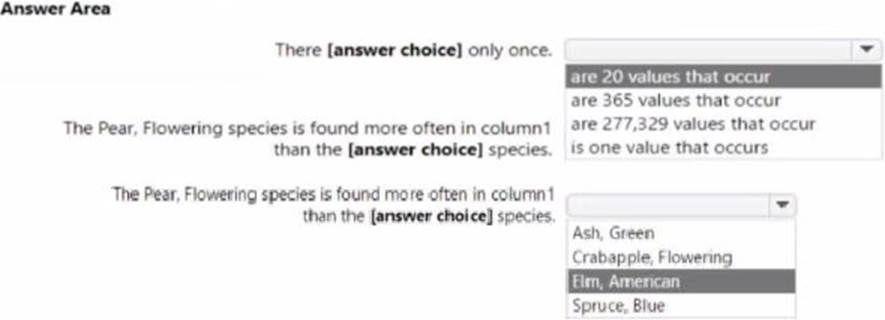
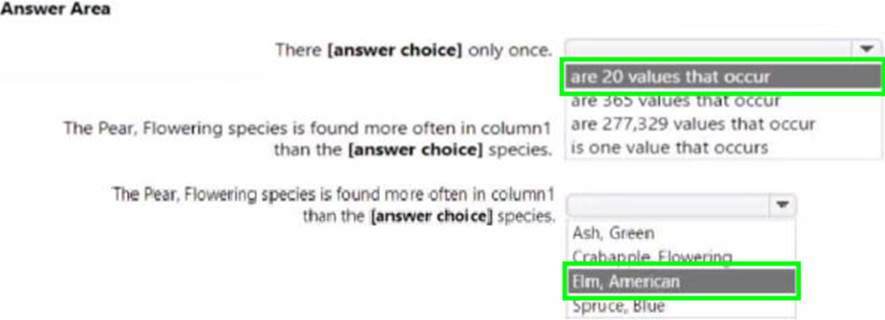
Suggested Answer:
Posted : 24/10/2022 2:36 pm